
Gering Geosolutions
Gering Geosolutions aims to harness the power of geospatial technology to enhance health equity by providing the tools and resources needed to identify disparities, inform policy decisions, and empower communities. We believe every individual should have equal access to the health resources and services they need regardless of location or socioeconomic status.
Services
Turn your data into decision-ready insights
Community Health Assessments (CHA) that Drive Community Change
We combine rigorous data analysis with community engagement to identify health priorities, understand barriers, and provide clear direction for programs, funding, and system-level change.
Data Walks that Move Communities from Information to Action
We transform complex data into accessible, engaging visuals and guide communities through structured conversations that build awareness, deepen understanding, and identify priorities for change.
Suitability Analysis to Guide Smarter Public Health Planning and Investment
We use advanced geospatial analytics to identify where programs, services, and resources will have the greatest impact. By combining demographic, environmental, infrastructure, and health indicators, we help communities make data-informed decisions about where to focus efforts, funding, and interventions.
Grant Writing & Grant Master File Development that Strengthens Your Funding Readiness
We help organizations build competitive grant proposals and create a centralized Grant Master File that keeps essential documents, narratives, data, and organizational information ready to use. The result: faster submission timelines, stronger applications, and less stress when funding opportunities arise.
Rapid Insight Suite: Fast, Focused Analysis for Decision-Ready Results
When you don’t need a full assessment—but you DO need clarity—our Rapid Insight Suite delivers quick-turn analyses, visual summaries, and meaningful interpretation so you can answer key questions, brief leadership, and move forward with confidence. Services start at $60!
Data Visualizations & Dashboards that Turn Complex Information into Clear Insight
We design intuitive, visually compelling dashboards and data displays that help leaders, partners, and communities understand trends, explore key questions, and make informed decisions with confidence.
SAMPLE WORK
Building Healthier Communities

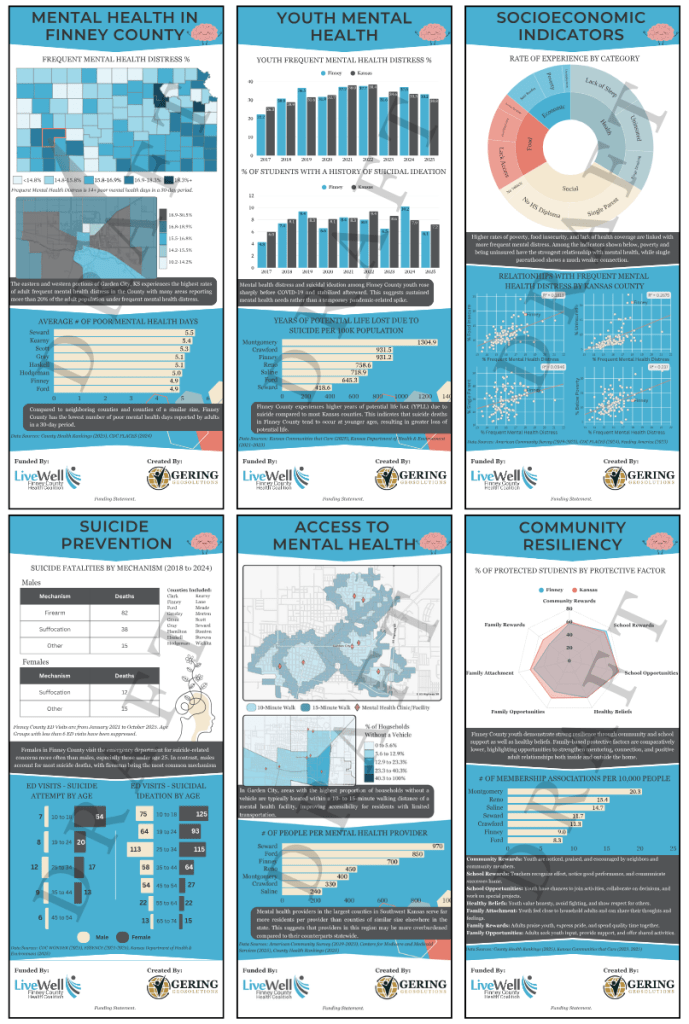
Reno County, Kansas Community Health Assessment
A 200-page report about community health in Reno County, Kansas featuring an interactive webpage for the public and stakeholders to view the results.

Food Insecurity Data Walk in Reno County, KS
An event designed to engage community members in discussion about food insecurity and food access issues in Reno County. The data walk featured 7 banners and 2 interactive smartboard displays.
Esri Case Study on SDOH for Overdose Prevention
Using GIS to map overdose trends, identify high-risk locations, and guide targeted prevention and naloxone distribution efforts.
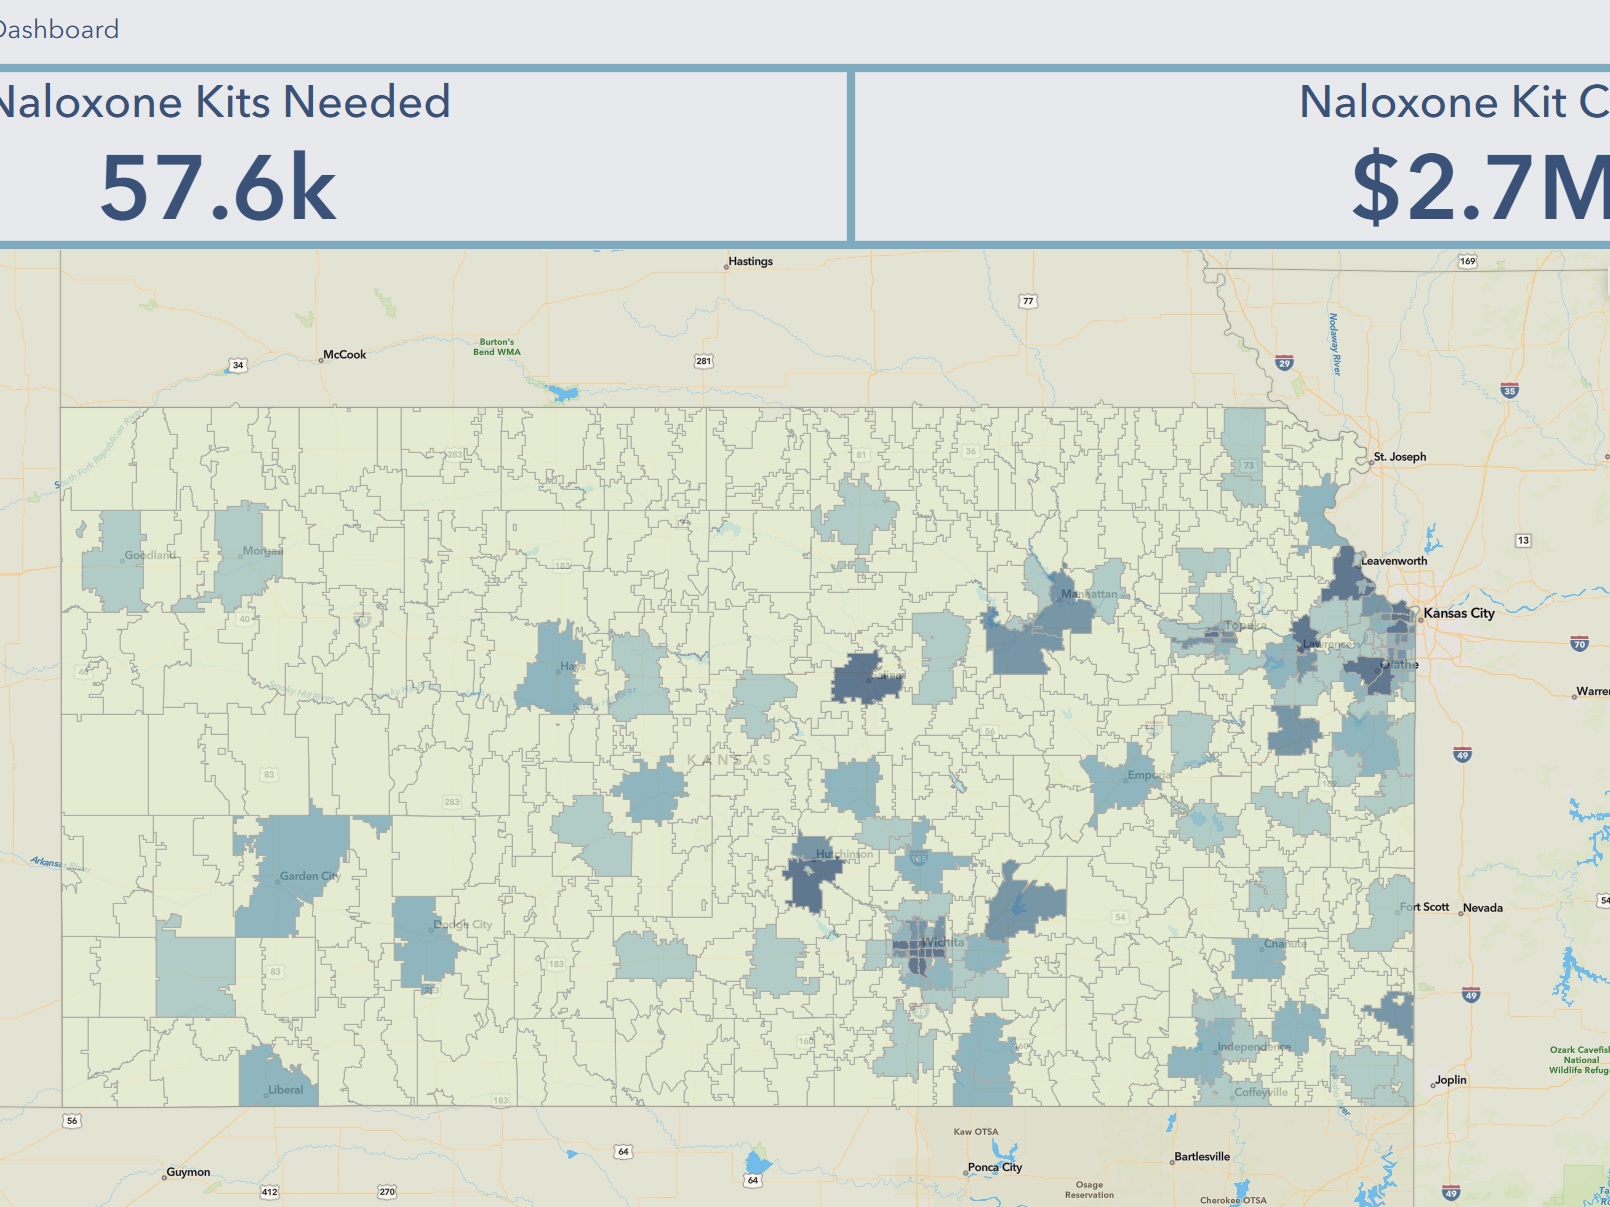
Naloxone Saturation Dashboard
A project estimating how much naloxone is needed in each Kansas zip code to save the most lives from an overdose.
FAQs
What data visualization and analytical tools do you use?
We primarily use the ArcGIS platform for all geospatial analysis and data visualization. SAS is utilized for complex data clean-up and quantitative analysis. ATLAS.ti is used for qualitative data analysis. PowerBI is used for visualizations that are less focused on mapping.
How do you integrate health equity into geospatial tools?
Health equity is about meeting people where they are at. With that in mind, we prefer projects focused on a smaller geographic level, such as census tracts rather than zip codes or counties. This provides a more detailed outlook for allocating resources and planning public health initiatives.
What is your policy on revisions and changes to the project scope?
We know there will likely be new ideas that pop up during the process, so we welcome any changes to the project. The only changes in cost will come from the expansion on deliverables and timeline.
What kind of communication can we expect?
We want you to be satisfied with the end result of your product. We encourage semi-frequent communication (bi-weekly or as needed) to go over progress, deliverables, and requested changes. Being transparent and straight forward with feedback and comments helps us deliver the best final product we can.
How much do your services cost?
Our fees vary based on the project size and scope.
We provide free consultations, so reach out to us and see if we are the right fit for your next project.
How do you protect HIPAA data?
We will never ask you for any identifying information. If you decide you want census tract level data but cannot do it without giving us addresses, we will walk you through how to geocode the data to provide us a file that does not identify the subjects.
What technology do you have to use for projects such as the CHA and Data Walks?
We have two 55″ interactive smartboards for hosting visuals for data walks and five Samsung tablets to conduct in-person surveys or showcase more interactive data. We want individuals to become immersed in the data rather than feel like they’re reading a textbook.
We will purchase more technology if required to complete your project.
What kind of support do you provide after the project is completed?
We can continue to provide support after a project is finished, especially on data visualization tools. For example, if you want to update a dashboard based on new/updated datasets, we can do that for you.
As long as the update is not a substantial overhaul of the tool/dashboard, we can update and refresh it for a low cost.
Consultation
How can geospatial software improve your goals?
Schedule a free consultation to find out how we can help advance your work.