Turn data into dialogue.
We design engaging, evidence-driven Data Walks that make data accessible to everyone. Using GIS-powered visuals, storytelling, and community engagement, we turn complex data into meaningful, local insight.
Pricing begins at $4,000 for seven stylish banners.

What is a Data Walk?
A Data Walk is an interactive visual experience. Participants move through displays of local data, charts, maps, infographics, and stories, that invite reflection on community health challenges and opportunities.
These experiences transform numbers into narratives. Rather than reading a static report, people engage with data in motion. Each banner and screen invites questions, discussions, and personal connections, and as participants move from station to station, they see how the data connects to families, neighborhoods, and systems.
They are also intentionally inclusive, bringing together residents, local leaders, and organizational partners who might not otherwise interact. Through conversation and shared learning, participants recognize trends, voice concerns, and imagine solutions, building both understanding and momentum for collective action.
Data Walk service options.

Interactive Digital Dashboard Displays
Includes work in ArcGIS Dashboards, Experience Builder, or StoryMaps, plus hosting our 55-inch smartboard at your event (within a 5-hour drive of Lawrence, KS; travel and equipment fees apply beyond that). Add a second smartboard display for $1,000. Keep the dashboards on your own site or displays afterward, and we will host them for up to five years. See a sample StoryMap.
How can Data Walks help?
In essence, a Data Walk is a powerful tool for:
- Sparking conversation across organizations and residents
- Identifying equity gaps and community priorities
- Encouraging data-driven decision-making
We integrate data from multiple sources, community surveys, Census data, and ArcGIS-based analyses, to create clear, localized visuals that guide action. This layered approach helps communities see not just what is happening, but where and why. We also follow best practices developed by the Urban Institute, emphasizing transparency, accessibility, and storytelling.


A proven, four-phase framework.
We tailor every Data Walk to your community, with each phase building on the last.
Planning & Theme Development
We identify the topics most relevant to your community, food insecurity, housing, mental health, and listen closely to your goals so every data point serves a purpose and the story resonates locally.
Data Analysis & Visualization
We translate key data points into engaging infographics, maps, and narratives, turning large datasets into visual stories decision-makers can read at a glance.
Design & Production
We create high-quality, seven-foot banners or digital exhibits with your branding, using accessible design so every attendee can engage with the material.
Community Facilitation
We host a walk-through and discussion to surface shared insights and next steps, turning dialogue into action.
Grounded in public health methodology, GIS analytics, and accessible design, so each event is not only informative, but transformative.
Reno County Food Insecurity Data Walk
In 2025, we partnered with the Reno County Health Department to visualize key findings on food insecurity as part of their Pathways to a Healthy Kansas project.
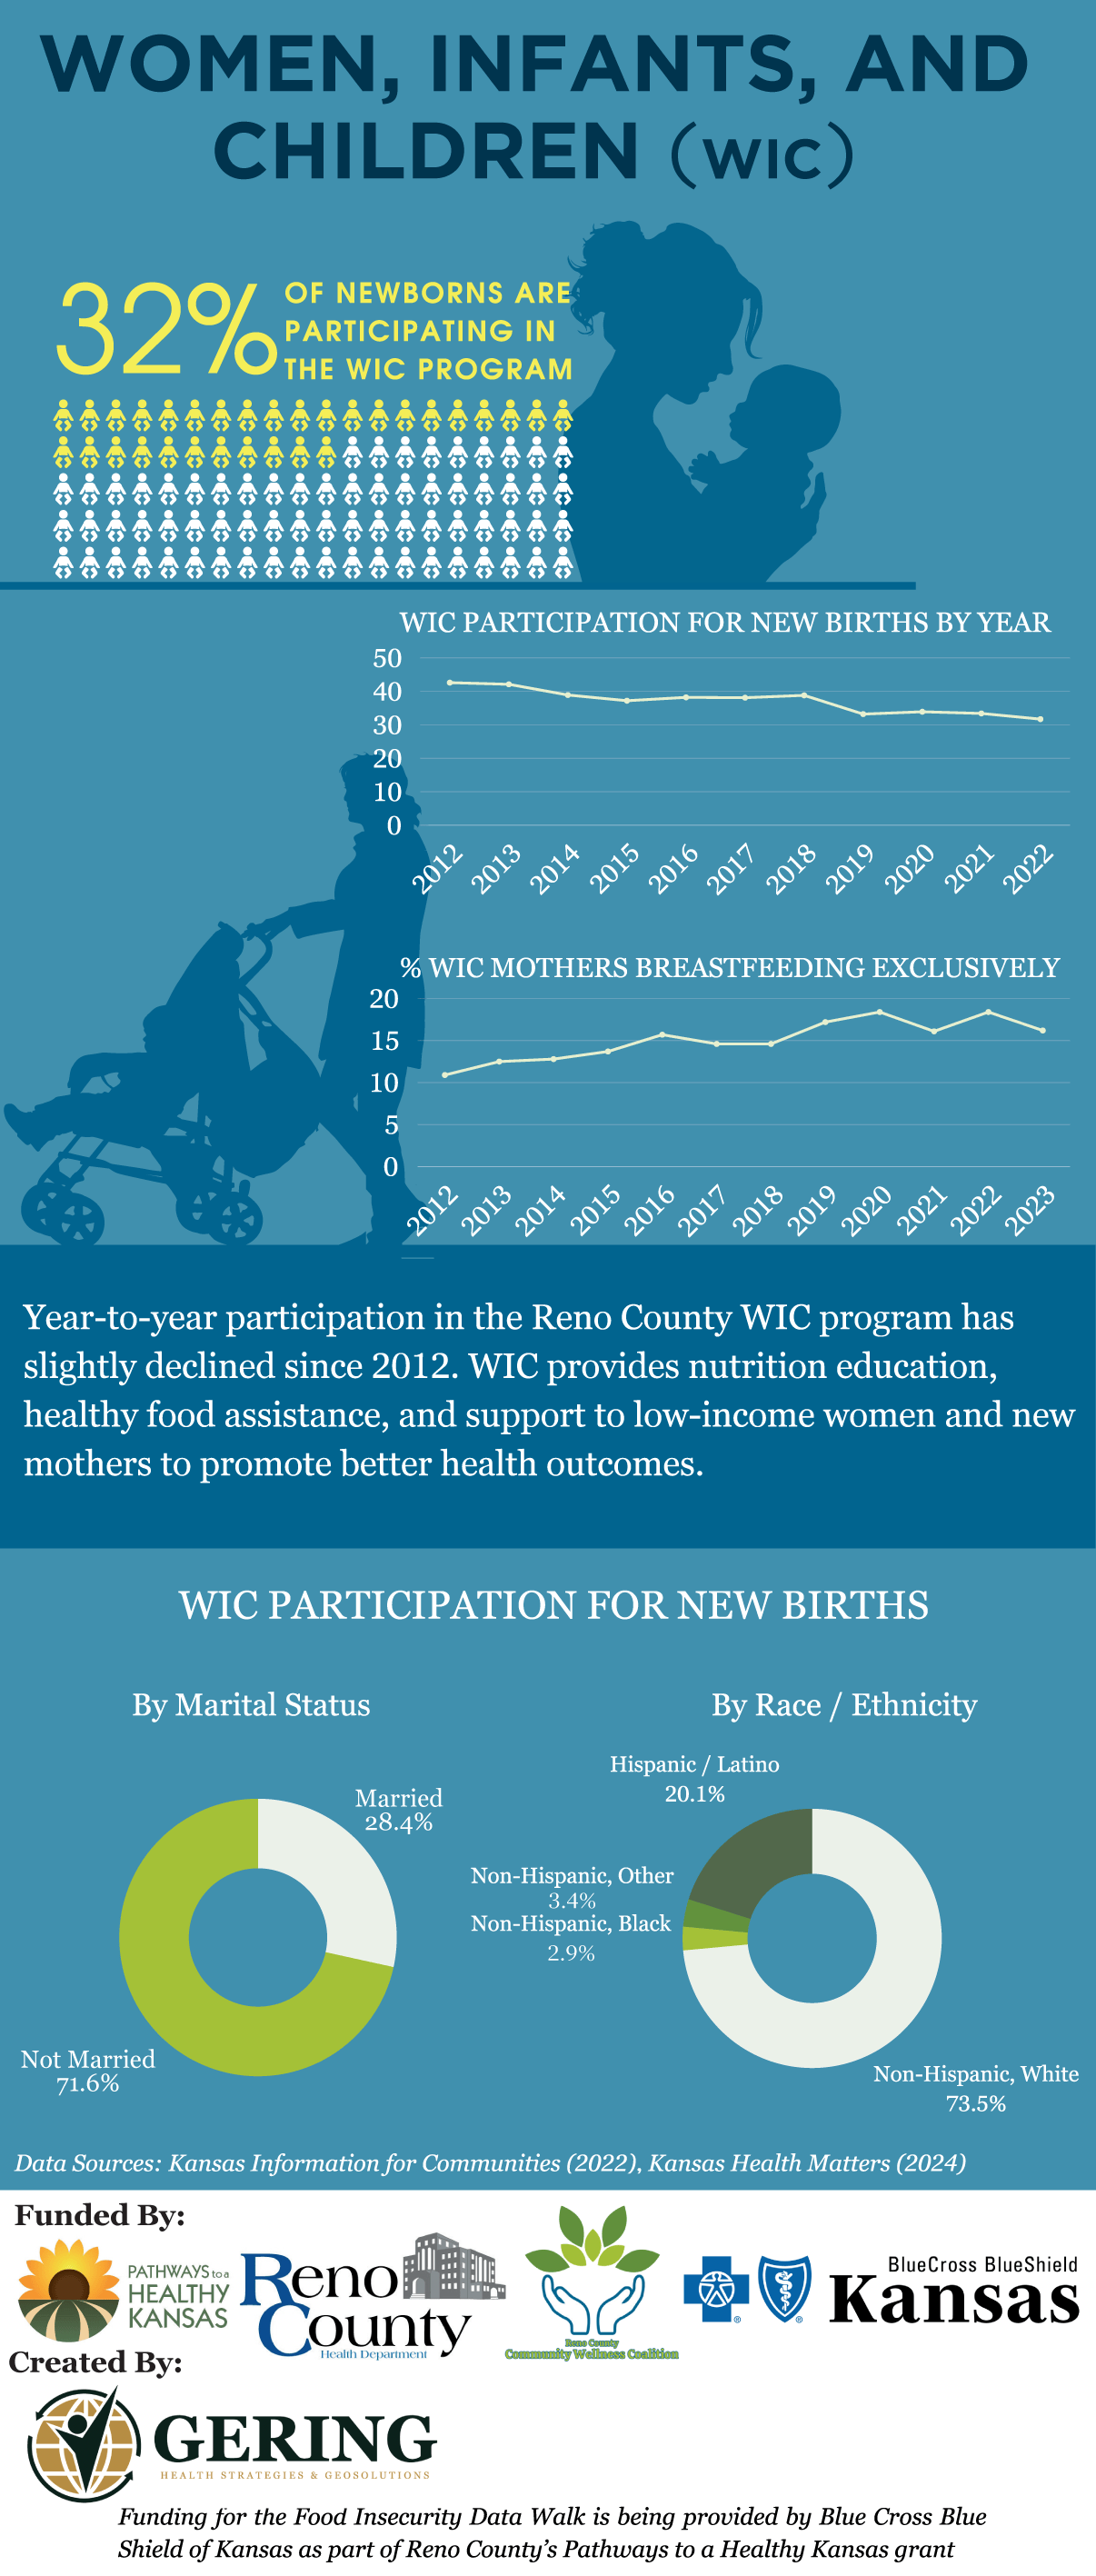
The event featured seven large banners with local maps, statistics, and visuals on access to healthy foods, transportation barriers, and community assets, plus two 55-inch smartboards running interactive dashboards showing drive-time and walk-time access to fresh produce.
The mix of static and digital displays let attendees explore countywide maps or zoom into specific neighborhoods, sparking new questions and inspiring local organizations to think more strategically about food access, infrastructure, and collaboration. Read the full story →

Local knowledge, end to end.
- Local expertise: deep experience across Kansas communities
- GIS integration: maps and analyses built primarily with ArcGIS
- Equity-centered: every Data Walk highlights disparities and strengths
- End-to-end service: from analysis to design, printing, and facilitation
Each project reflects years of work across rural and urban areas alike. We handle the full process so you can focus on community engagement while we manage the technical and creative details. View our recent projects →
Request themes such as:
- Food insecurity and nutrition systems
- Housing stability and neighborhood conditions
- Mental health and social connectedness
- Access to healthcare
- Economic opportunity and workforce development
- Child care
- Transportation and physical activity
- And more
Every Data Walk includes actionable recommendations, so participants leave not just with new insights but with tangible next steps to strengthen programs, partnerships, and policies.
Let’s make your data engaging and actionable.
Tell me what your community is working through and we will build a Data Walk that gets people talking.
Schedule a consultation →